• Hey, guest user. Hope you're enjoying NeoGAF! Have you considered registering for an account? Come join us and add your take to the daily discourse.

Mask Efficacy |OT| Wuhan!! Got You All In Check

Status
Not open for further replies.

Dr.Guru of Peru

played the long game
In actual virus-related news, a new kind of COVID-19 vaccine could debut soon. It works differently than the existing vaccines, and the manner in which they create it is fascinating.

There really isn't? It's just a traditional antigen vaccine.
 

Moomalade74

Banned
To further clarify my previous post regarding the complete lack of correlation between the introduction of mask mandates and the trajectory of cases per million in any territory that introduced it, here are a series of graphs from last year mapping when the mandates began against the case curves.

As you can see, there is no course correction or even minor deviation in the curve trajectories anywhere from the point of mandatory masks. There should be at least some sort of realignment is masks made a difference.

This is cold hard empirical evidence, based in the real world, that mask efficacy in preventing transmission is almost non existant.


9-4-West-Virginia-cases-1024x729.png


9-9-Miss-Cases-1024x737.png


9-15-Philippines-1024x701.png


9-17-Peru-1024x751.png


9-18-LA-cases-1024x657.png


9-19-Spain-1024x578.png


9-21-France-1024x619.png


9-21-Sweden-vs-LA-cases-1024x552.png


9-26-Spain_France-Masks-1024x612.png


9-1-Hawaii-cases-1024x686.png


9-3-So-Cal-_-Ventura-1024x805.png


9-4-Kansas-Cases-1024x733.png


9-29-Israel-Sweden-1024x739.png


Source for charts : https://ourworldindata.org/explorer...on=true&Align+outbreaks=false&country=GBR~SWE
 

Rentahamster

Rodent Whores
To further clarify my previous post regarding the complete lack of correlation between the introduction of mask mandates and the trajectory of cases per million in any territory that introduced it, here are a series of graphs from last year mapping when the mandates began against the case curves.

As you can see, there is no course correction or even minor deviation in the curve trajectories anywhere from the point of mandatory masks. There should be at least some sort of realignment is masks made a difference.

This is cold hard empirical evidence, based in the real world, that mask efficacy in preventing transmission is almost non existant.
In some of your graphs, the daily new cases goes up after the mask mandates, and in some areas, the daily new cases go down after mask mandates.

You keep talking about a "curve", but you are using the terminology wrong. These graphs are depicted in a linear scale, when instead they should be portrayed as a log scale because that's when the "curve" actually becomes relevant in terms of analyzing any exponential growth of the pandemic.

Your graphs don't control for other variables. This is a complex scenario, and just because a government mandates masks, doesn't mean that masks are available to use, or that the population knows how to use them correctly, or even complies at sufficient numbers.

Decide what you want to argue - are mask mandates effective or are masks themselves effective assuming proper use? Those are two different things, and I've already showed that masks work and that mask mandates can work as long as the people use them correctly and follow best practices in general infection control.

Next time use sources that understand statistics and analytics rather than some random website with an agenda to push.


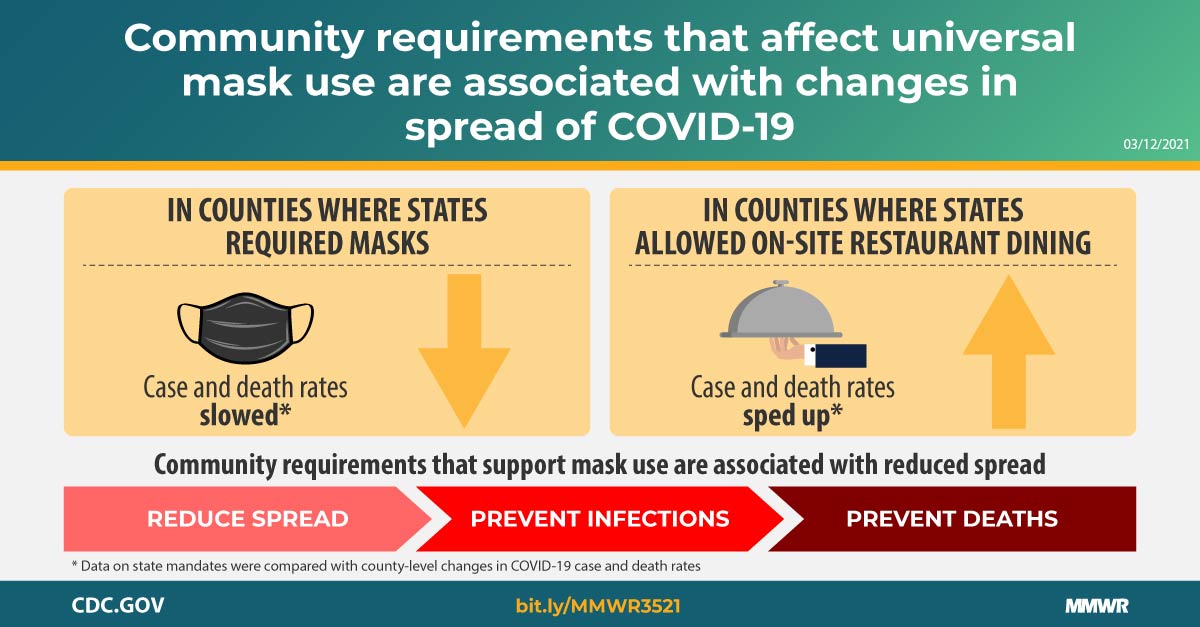
Mask mandates were associated with decreases in daily COVID-19 case and death growth rates 1–20, 21–40, 41–60, 61–80, and 81–100 days after implementation.

Mask mandates were associated with statistically significant decreases in county-level daily COVID-19 case and death growth rates within 20 days of implementation. Allowing on-premises restaurant dining was associated with increases in county-level case and death growth rates within 41–80 days after reopening. State mask mandates and prohibiting on-premises dining at restaurants help limit potential exposure to SARS-CoV-2, reducing community transmission of COVID-19.

Studies have confirmed the effectiveness of community mitigation measures in reducing the prevalence of COVID-19 (58). Mask mandates are associated with reductions in COVID-19 case and hospitalization growth rates (6,7), whereas reopening on-premises dining at restaurants, a known risk factor associated with SARS-CoV-2 infection (2), is associated with increased COVID-19 cases and deaths, particularly in the absence of mask mandates (8). The current study builds upon this evidence by accounting for county-level variation in state-issued mitigation measures and highlights the importance of a comprehensive strategy to decrease exposure to and transmission of SARS-CoV-2. Prohibiting on-premises restaurant dining might assist in limiting potential exposure to SARS-CoV-2; however, such orders might disrupt daily life and have an adverse impact on the economy and the food services industry (9). If on-premises restaurant dining options are not prohibited, CDC offers considerations for operators and customers which can reduce the risk of spreading COVID-19 in restaurant settings.*** COVID-19 case and death growth rates might also have increased because of persons engaging in close contact activities other than or in addition to on-premises restaurant dining in response to perceived reduced risk as a result of states allowing restaurants to reopen. Further studies are needed to assess the effect of a multicomponent community mitigation strategy on economic activity.
 

Moomalade74

Banned
In some of your graphs, the daily new cases goes up after the mask mandates, and in some areas, the daily new cases go down after mask mandates.

You keep talking about a "curve", but you are using the terminology wrong. These graphs are depicted in a linear scale, when instead they should be portrayed as a log scale because that's when the "curve" actually becomes relevant in terms of analyzing any exponential growth of the pandemic.

Your graphs don't control for other variables. This is a complex scenario, and just because a government mandates masks, doesn't mean that masks are available to use, or that the population knows how to use them correctly, or even complies at sufficient numbers.

Decide what you want to argue - are mask mandates effective or are masks themselves effective assuming proper use? Those are two different things, and I've already showed that masks work and that mask mandates can work as long as the people use them correctly and follow best practices in general infection control.

Next time use sources that understand statistics and analytics rather than some random website with an agenda to push.


My argument is that masks are not effective in controlling or reducing transmission as demonstrated by current real world data.
So you have no real answer to this data other than to shift the goalposts and now say it's all very complicated, with lots of variables. However the spread of data is so large that I presented, there should be some aggragated noticable effect.
You describe how the graphs go down and up after mask mandate introduction, but you are not accounting for trajectory, that is the entire point. irrespective of which direction the graph was going, the mask mandate did not provide a deviation.

Your link to the cdc is merely a summary report, with a stated outcome. Please provide a more direct link to real world aggragated data that supports your position that mask mandates made a positive contribution to the prevention of transmission in society. I suspect you have no such data, hence your relience on dubious youtube video experiments. I prefer real world evidence on this matter, of which there should be an abundance, given the wide spread implementation of mask mandates world wide, not theoretical suppositions.

The website you describe as 'some random website with an agenda to push' derives it's data from here:
Our World in Data is produced as a collaborative effort between researchers at the University of Oxford, who are the scientific contributors of the website content; and the non-profit organization Global Change Data Lab, who owns, publishes and maintains the website and the data tools.

At the University of Oxford, the research team is affiliated with the Oxford Martin Programme on Global Development, where the mission is to produce academic research on the world’s largest problems based on the empirical analysis of global data.

And here are the Trustees:

Professor Wendy Carlin​

Wendy Carlin is one of the directors at Global Change Data Lab, and she is a founding member of our Board of Trustees. She is Professor of Economics at University College London, Research Fellow of the Centre for Economic Policy Research, and an external professor at the Santa Fe Institute. She is also leading the CORE Project, an international educational project to reform the undergraduate economics curriculum. The CORE Project produces open-access e-books used in universities around the world. She is also a member of the Expert Advisory Panel of the UK’s Office for Budget Responsibility.

Professor Sir David Hendry​

David Hendry is one of the directors at Global Change Data Lab, and he is a founding member of our Board of Trustees. He is also co-director of Climate Econometrics at Nuffield College. He was previously Professor of Economics at Oxford University where he was Chairman of the Economics Department from 2001—2007. He was knighted in 2009, and he is an Honorary Vice-President and past President of the Royal Economic Society.

Professor Stefano Caria​

Stefano Caria is one of the directors at Global Change Data Lab, and he is a founding member of our Board of Trustees. He is an Associate Professor in the Department of Economics at the University of Warwick specializing in development economics. He is also affiliated with J-PAL, CEPR, CAGE and the EEE program at STICERD.
 

Rentahamster

Rodent Whores
So you have no real answer to this data other than to shift the goalposts and now say it's all very complicated, with lots of variables.
I'm not shifting the goalposts. I'm telling you that your analysis doesn't prove what you think it does, and I explained why.

The website you describe as 'some random website with an agenda to push' derives it's data from here:
I'm not talking about that one. I'm talking about https://rationalground.com/ the one that doesn't know how to do pandemic analysis. The one where your graphs are from.
 

Moomalade74

Banned
I'm not shifting the goalposts. I'm telling you that your analysis doesn't prove what you think it does, and I explained why.


I'm not talking about that one. I'm talking about https://rationalground.com/ the one that doesn't know how to do pandemic analysis. The one where your graphs are from.

The graphs are the same as the ones from Our World In Data. Please show where they are inaccurate or where the dates of mask mandate implementation are inaccurate. Just casting aspersions does not further your case.

The graphs show that there is a complete absence of any evidence that masks had any influence on case numbers per million over a time period.
The onus is on those who support mask mandates to provide the actual evidence to counter this, in the form of whatever pandemic graph analysis (on a societal level, not lab experiment) which you consider more relevant. You have demonstrably failed to do so, therefore I'm going to assume you have nothing other than a basic summary report and an irrelevant youtube video.

To reiterate, there should be an abundance of evidence at this stage to show clear course correction to transmission rates from the time of mask mandate implementation on a societal level. Let's see it.
 
Last edited:

llien

Member
Number of new cases is a function of MANY variables, some of which are hard to control (e.g. how many people do not give a fuck about restrictions).

You cannot just look at it and make even remotely reliable conclusions about pretty much ANY of the variables, including, but not limited to, wearing masks.
 
Last edited:

Raven117

Member
It may be worth checking out Era on this (a small thread only 3 pages), who are absolutely in denial that Fauci could have been misleading in some of this stuff. The mental gymnastics. They cannot comprehend that they were mislead.

He absolutely understood that Covid-19 could have possibly come from the Wuhan lab. Possibly. Him (with the help of the media), spun it where they could not possibly ever be the case and pushed another theory. That is deliberately misleading when the answer was "We don't know where it originated other than it first was identified in China."

The mask thing, that one is not as egregious to me (other than him absolutely knowing it didn't do much to stop the transmission of the virus), but then he went on to say "two masks" later on.

I don't envy his position, but he didn't really course correct. That's the issue with me.

He knew the Wuhan Lab Theory was real (and that the U.S. donated to it). He spun it that it came from animal to human directly.

He knew masks were not helpful (or at best very marginally). Instead, of saying what the science really showed (that its marginal), he let the media spin that the mask was essential. Same with lockdowns. That they were the only way.

My issue is that he tried to spin the science to where he wanted the policy to go, and didn't let the science drive his decisions and recommendations. And he damn sure didn't come off of those recommendations in the face of contrary evidence.

What are you talking about? The majority of our conversations have been about mask efficacy and "following the science". You kept claiming that masks don't do anything, and I kept quoting science sources to show you that there is a preponderance of evidence to suggest that they do.


I read the actual science and I'm not trying to spin it. I'm showing that the effect is more than marginal. I've quoted multiple studies with multiple varieties of methodologies. You say you care about science without spin, and that is the conversation that I'm trying to have with you.
These were my posts on Friday (there could be more). As you can see, the point was to discuss Fauci and mostly Wuhan. Also the discussion of science groupthink.

You are missing the forest for the trees at least with me and then arrogantly state what you only wish to discuss after you responded to me talking about something different.
 

Guileless

Temp Banned for Remedial Purposes

When the Fauci emails dropped, Andersen actually tweeted that he changed his mind about the origins of the virus because his ideas evolved due to "science." Daszak chimed in to give him props. The replies were quite a tire fire, even by Twitter standards. Not surprised he checked out.
 
Last edited:

BadBurger

Banned
When the Fauci emails dropped, Andersen actually tweeted that he changed his mind about the origins of the virus because his ideas evolved due to "science." Daszak chimed in to give him props. The replies were quite a tire fire, even by Twitter standards. Not surprised he checked out.

Andersen also spearheaded the Lancet-published study (started four days following his email to Fauci) and published in February - maybe March? Anywho, people are basically watching the scientific process in action and the usual kinds of folk are jumping to conclusions or misunderstanding it. It's nothing new really, par for the course.
 
D

Deleted member 17706

Unconfirmed Member
The Y-axis is a logarithmic scale not a linear scale. A log scale is used when the numbers are really large in difference which would make your graph look weird. Here are a couple of helpful videos explaining this:


You can also find larger pictures and additional observational text in this link:


Viral loads in the inhalation droplets/aerosols were inversely proportional to the distance between the virus spreader and the virus receiver; however, infectious virus was detected even 1 m away (Fig. 2A). The blue bars and the brown bars in the figures show the viral titers and viral RNA copy numbers, respectively. The numbers below each bar show the percentages relative to the leftmost control column values. When a mannequin exposed to the virus was equipped with various masks (cotton mask, surgical mask, or N95 mask), the uptake of the virus droplets/aerosols was reduced. A cotton mask led to an approximately 20% to 40% reduction in virus uptake compared to no mask (Fig. 2B). The N95 mask had the highest protective efficacy (approximately 80% to 90% reduction) of the various masks examined; however, infectious virus penetration was measurable even when the N95 mask was completely fitted to the face with adhesive tape (Fig. 2B). In contrast, when a mask was attached to the mannequin that released virus, cotton and surgical masks blocked more than 50% of the virus transmission, whereas the N95 mask showed considerable protective efficacy (Fig. 2C). There was a synergistic effect when both the virus receiver and virus spreader wore masks (cotton masks or surgical masks) to prevent the transmission of infective droplets/aerosols (Fig. 2D and andEE).

We next tested the protective efficacy of masks when the amount of exhaled virus was increased. The viral load was augmented to 108 PFU and exhaled by the spreader; then the uptake of the virus droplets/aerosols was measured when various types of masks were attached to the receiver. As with the lower viral load (5 × 105 PFU) shown in Fig. 2B, the N95 mask sealed with adhesive tape showed approximately 90% protective efficacy (see Fig. 2F and andGG for a comparison of two N95 products). When the amount of exhaled virus was reduced to 105 PFU or 104 PFU, infectious viruses were not detected, even in the samples from the unmasked receiver (Fig. 2H and andI).I). Viral RNA was detected in all samples; however, due to the quantitative decrease, there was no difference in protective efficacy among all of the masks, including the sealed N95 masks.

Our airborne simulation experiments showed that cotton masks, surgical masks, and N95 masks had a protective effect with respect to the transmission of infective droplets/aerosols and that the protective efficiency was higher when masks were worn by the virus spreader. Considerable viral loads have been detected in the nasal and throat swabs of asymptomatic and minimally symptomatic patients, as well as those of symptomatic patients, which suggests transmission potential (4). Accordingly, it is desirable for individuals to wear masks in public spaces. Importantly, medical masks (surgical masks and even N95 masks) were not able to completely block the transmission of virus droplets/aerosols even when fully sealed under the conditions that we tested. In this study, infectious SARS-CoV-2 was exhaled as droplets/aerosols and mask efficacy was examined. To allow quantification, we conducted our studies by using a relatively high dose of virus, and under these conditions, it is possible that the protective capacity of the masks was exceeded. Although the efficiency of detecting infectious virus was reduced when the amount of exhaled virus was reduced, viral RNA was detected regardless of the type of mask used. These results indicate that it is difficult to completely block this virus even with a properly fitted N95 mask. However, it remains unknown whether the small amount of virus that was able to pass through the N95 masks would result in illness.


Thanks. I edited and updated my post about 6 hours before you made this reply, but allow me to reply here just in case you didn't see it.

Upon further investigation, I think I may have been thinking about it completely backwards, and I needed to be using an anti-logarithm calculator to get the right numbers. So, a 5 on the chart does not represent 0.69897 PFU, but 100,000 PFU and 4.8 does not represent 0.68124 PFU, but 63,095.7 PFU. That gets us to around 63.1% in F, so a lot closer to the stated 57%, and since I'm just eyeballing the chart (I wish they published the actual numbers) it may be accurate.

I guess the question then becomes: does the reduction demonstrated in this experiment a. translate to real world settings, and b. actually lead to reduced infection if so? I don't know what the viral load threshold is to causing infection, but I imagine there are a lot of variables that determine that.

One thing that was very interesting to me about this test is that it seems to indicate that, even when two people are not wearing masks in a completely sealed tiny box, simply being distanced by 50 centimeters cut the detected viral load by over half, and at 100 centimeters the detected amount was reduced by 70% or more. With that said, it's also important to recognize that the study acknowledges that this experiment does not necessarily imply that masks will reduce infections, since lots of viral RNA got through regardless of the scenario they tested:

To allow quantification, we conducted our studies by using a relatively high dose of virus, and under these conditions, it is possible that the protective capacity of the masks was exceeded. Although the efficiency of detecting infectious virus was reduced when the amount of exhaled virus was reduced, viral RNA was detected regardless of the type of mask used. These results indicate that it is difficult to completely block this virus even with a properly fitted N95 mask. However, it remains unknown whether the small amount of virus that was able to pass through the N95 masks would result in illness.
 

Jezbollah

Member
I wonder if we can have a separate thread on COVID cases and vaccinations progress.

This one is too full of mask efficacy and the Fauci email leak/vaccine origins stuff.
 
D

Deleted member 17706

Unconfirmed Member
I wonder if we can have a separate thread on COVID cases and vaccinations progress.

This one is too full of mask efficacy and the Fauci email leak/vaccine origins stuff.

I don't really understand why a separate thread would be needed. There are almost 40,000 posts in this thread and it has been going since the beginning of the pandemic. Each time significant news comes up, that typically becomes the dominant topic of discussion. I honestly don't see why the thread title was changed just because there have been a few pages of discussion about mask efficacy...
 
Status
Not open for further replies.
Top Bottom