EEDAR's founder Geoffrey Zatkin did the annual EEDAR data presentation on the games industry and consumer habits. Here are the notes from GameDev.net (no articles yet)
Images from Twitter

Trends
- Gamers are entertainment consumers on every possible medium
- 65% of US population are game players
- Who games?
- 48% of population in 2016
- Households on average have 2 consoles
Platforms
- Wii most popular platform over 100m units
- 50M PS4s
- 85m Xbox 360 and PS3
- 3DS 65M
- Core consoles in current generation (8th) - (w/out Nintendo) - are outselling 7th generation
- There is a shift from a balanced portfolio of genres to a more core focused portfolio of shooter and action genres. Casual genres slowing trend.
Genres
- Mobile most popular: Puzzle, Arcade, Strategy
- Console most popular: Action, RPG, Shooter
Mobile
- Most gamers play games on a variety of devices
- Different games depending on device available or time
- Most people upgrade phones 18-24 months
- Average smartphone 6 months to 1 year old
- Android fragmentation making market sizing difficult - variety of device power and not all games can run on all devices
- North American mobile market is maturing
- Fewer new device owners entering market
- Gaming population increasing faster than hardware adoption
- 155 million mobile gamers in 2016
Large percent of mobile gamers owning more than one device generate revenue
- 51% own more than one mobile device
- 60% of revenue
Virtual Reality
- More VR units in mobile
- High end VR (PSVR, Oculus, Vive) making most revenue
- Critical mass of VR hardware is building - enough to begin having a profitable VR ecosystem
Demographics
- Average age of gamers in US 2016: 35
- Age distribution:
- ​Less than 18 yrs old - 27%
- 18-35 yrs old - 29%
- 36-49 yrs old - 18%
- 50+ yrs old - 26%
- Mobile market payers also shifting older y/o/y - 37 yrs old 2016 vs 32 2014
- 60/40 ratio of male/female gamers
- More women playing games longer than people think
- Men tend to play PC (64%), Women tend to play mobile (55%)
- 55% women pay in mobile
Distribution
- Barriers to create games of quality have never been lower, yet retail console, handheld, PC title releases in 2016 lowest its been
- But when we consider Retail and Digital distribution - most ever.
- 6500 games released for console, PC, handheld
- 4600 games released on Steam in 2016
- 2015 - 3400 games
- 2014 - 1500 games
- More games on Steam last year than the entire console, handheld, etc.
- No more physical-only released games in consoles - digital distribution always included
- Number of games released by publishers has decreased
- Massive consolidation in top tier publishers, more stringent, less risky
- 50% drop in games released by publishers since 2012
Financials
- $16.5 billion industry in US
- ~1/3 of revenue coming from mobile
- Mobile payers defined as less than $100 per year spent average of $43 in 2016
- Heavy payers defined as over $100 spent average of $310 in 2016
- Population of heavy payers has increased
- More people in category, but less per average
- 7% of mobile gamer population brings in 55% of mobile revenue
- Heavy correlation between people who play and people who pay
- Top 50% of games generate 99% of revenue
- Top 10% of games generate 60% revenue
- Top 2% of games generate 30% revenue
- 12% of retail titles have generated 75% of retail revenue since 2012
Discoverability and Behavior
- Average review score in industry is 69 - below 80 which is the cutoff in consumers for good enough game
- Most games receive a score in 70s
- Advertising matters. Without good marketing you may do well but never as well as you could and usually substantially less.
- Direct correlation between review scores and sales.
- Those who market get ~2x in sales. Discovery is the biggest issue for developers.
- Top factors affecting discovery
- ads in apps, games, social media
- social sources
- ads on website
- storefront charts/featured
- Price and Genre key factors affecting engagement
- User reviews, theme/graphics, recommendations are top factors. Storefront elements (featured, top spot, trailers) bottom factors.
- Players leaving the game - key factor was general loss of interest/boring
- Might leave for a better user experience.
- Perspective is very important in your game
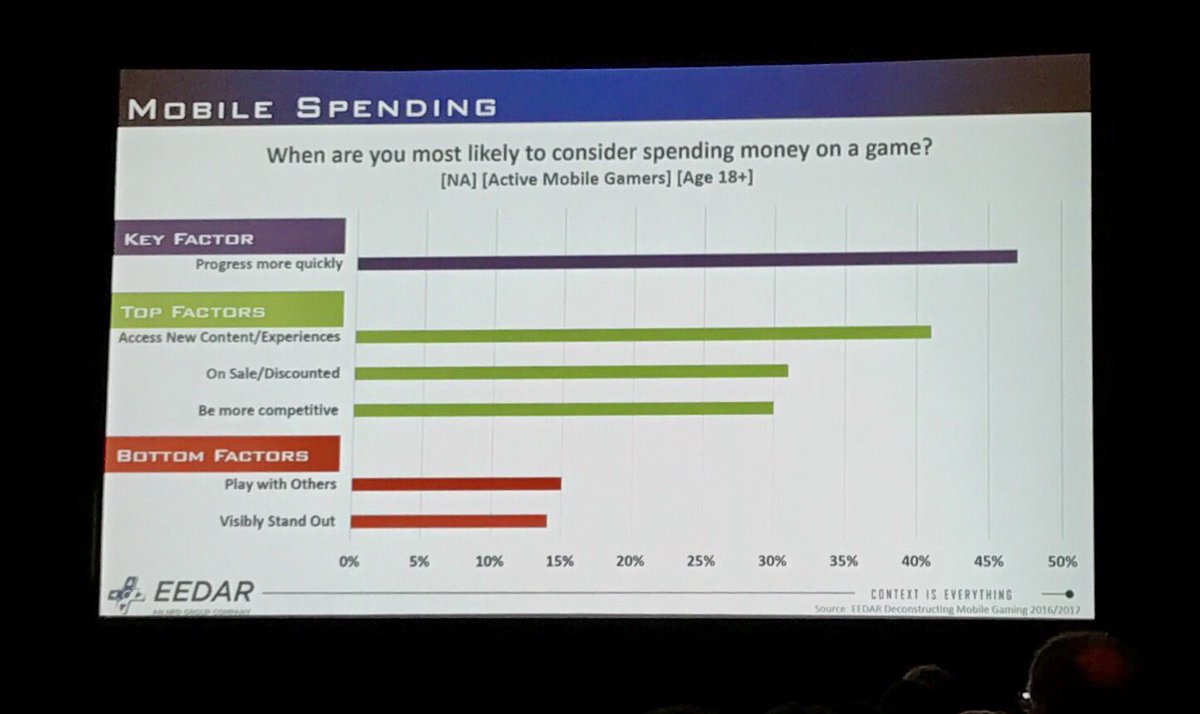
- Top factors: had to pay real money to progress/complete, game was not what expected.
- Western plays are okay with spending money to progress quickly despite stigma in paying to play
- Top 5 most played genres
- brain puzzle
- matching puzzle
- skill and chance
- casino
Kickstarter
- 29,216 successfully funded projects
- $600 million to games
- $535m successful
- $53m unsuccessful
- $5.6m live dollars
- Some using kickstarter as a marketing opportunity or to engage commnity earlier
- ~1/3 successfully funded
- This year so far, 76 games > $1million. 3867 games $1k to 10k, most popular funding level
- Kickstarter getting more difficult, especially as more finished games enter
- 67% of unsuccessful get < 20% funded
- More than half the games on kickstarter got no significant money
Pokemon Go
Virality - more than 1/3 heard of game from friend. App Store 5%
Images from Twitter